43 Interesting UX Statistics to Bookmark in 2026
Share
Share

Get a quick blog summary with


Key Highlights
- Good UX helps users move faster, trust your brand, and take action, which can lift conversions and support growth.
- This roundup shares 43 UX statistics for 2026 and beyond, giving teams a quick view of where user experience is heading.
- The article pulls data from trusted public sources and in-house research, making the insights more useful for planning and strategy.
- The stats are meant to help designers, developers, and business teams make better UX decisions based on current trends.
User experience (UX) plays a critical role in shaping how people interact with digital products and services.
A strong UX design can improve conversions, boost retention, and directly impact business growth.
In this statistical roundup, we have compiled 43 of the most relevant UX statistics for 2026 and beyond to help designers, developers, and businesses stay ahead of trends.
The data and insights presented here are collected from trusted publicly available sources along with our extensive in-house research.
To ensure transparency and accuracy, we have included the source URLs at the bottom of this article
Top user experience (UX) Statistics at a Glance
- Personalization: Drives 90% higher user loyalty.
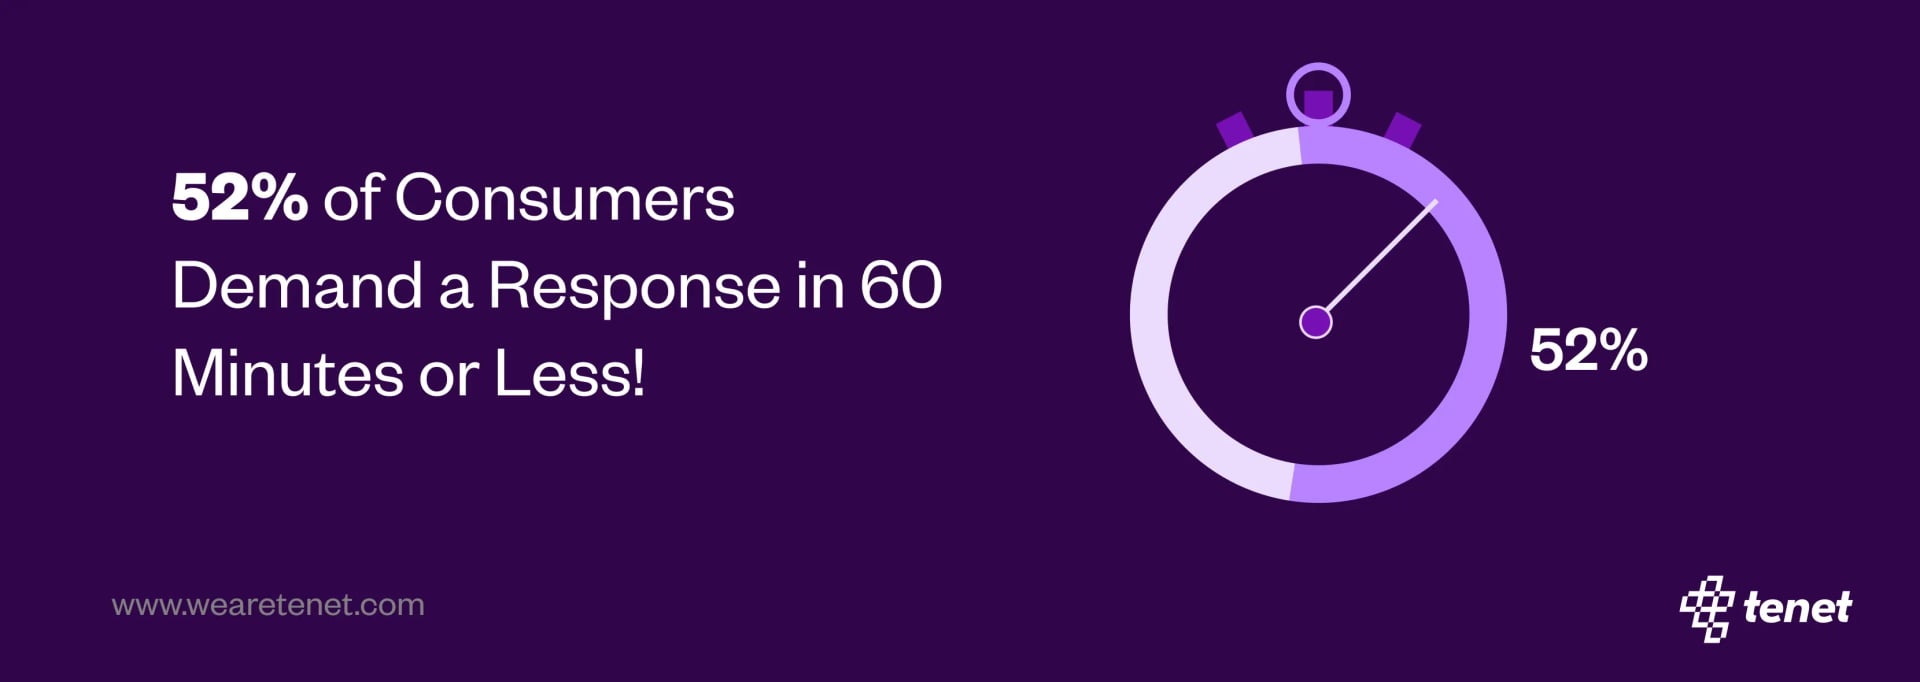
- Response Time: 52% of users expect a response within one hour.
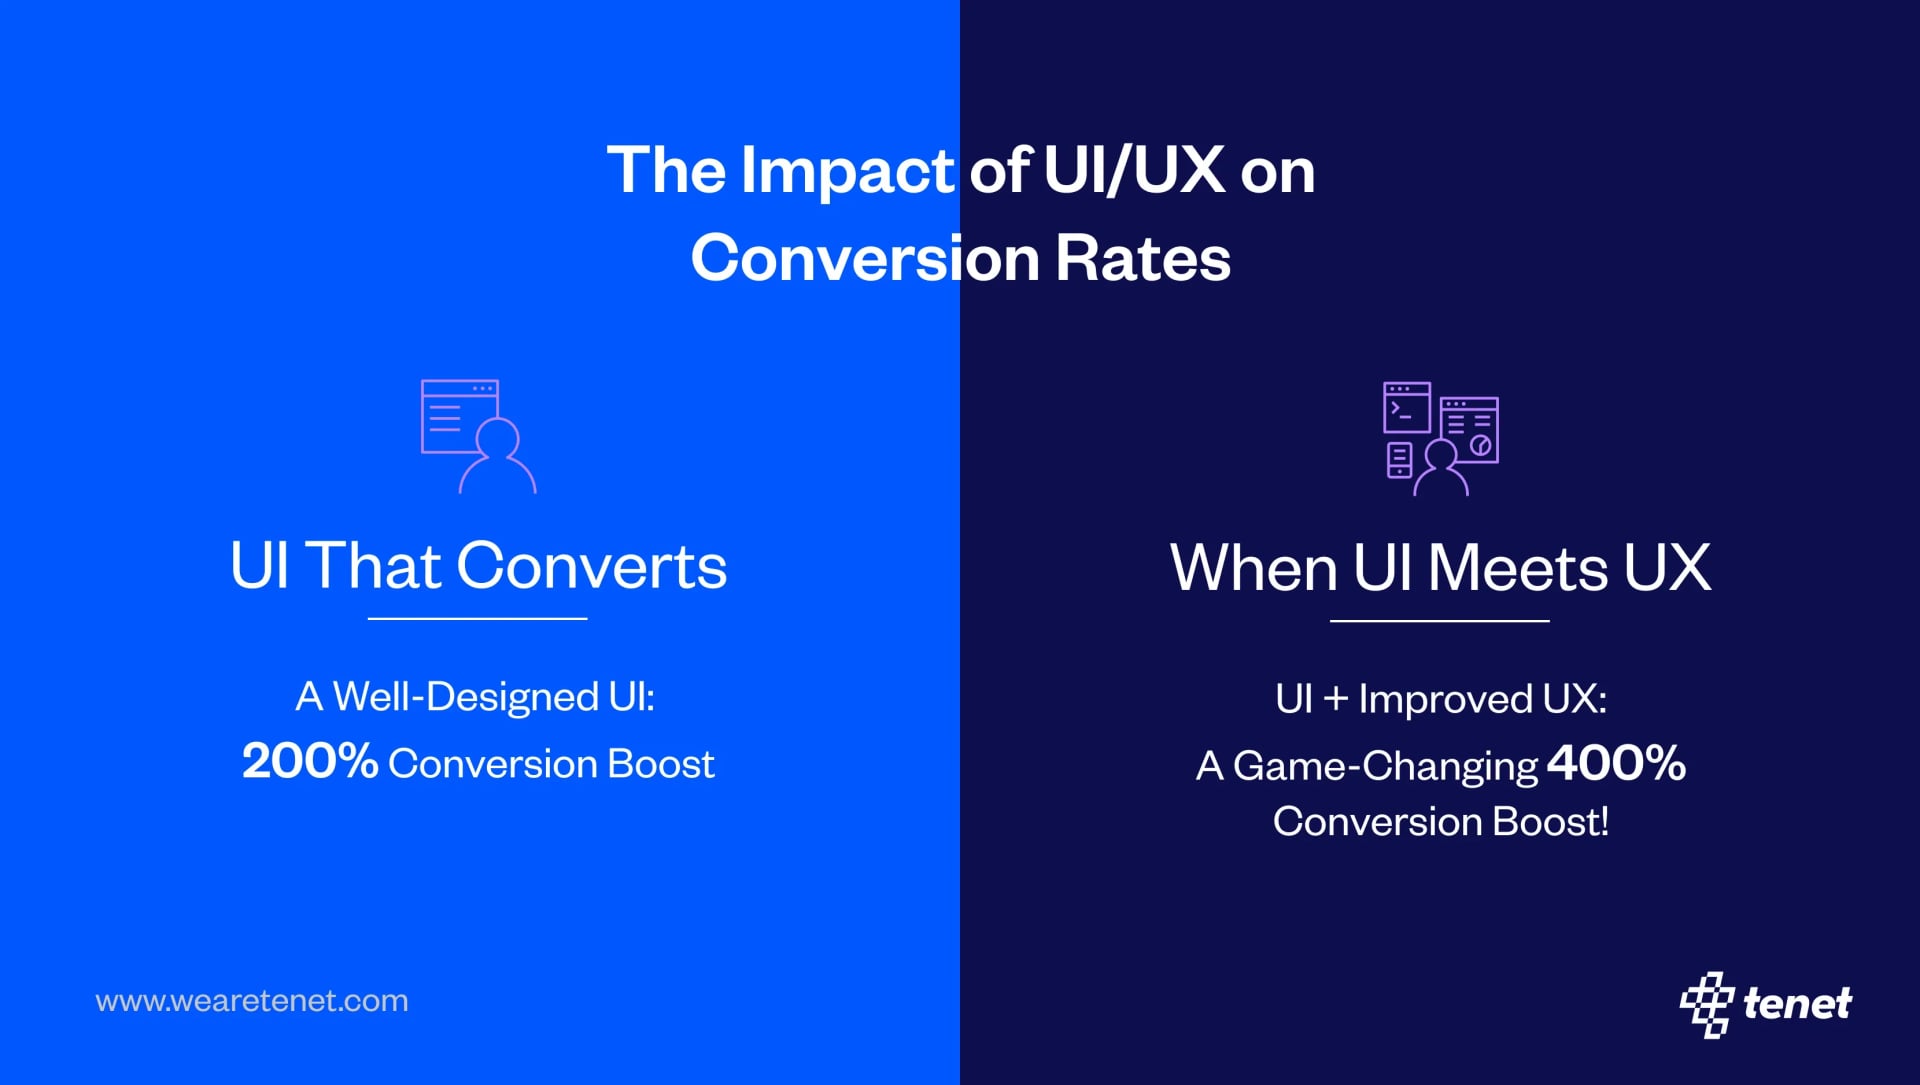
- Conversion Increase: A well-designed UI can increase website conversion rates by up to 200%, while improved UX can boost conversions by up to 400%.
- Preferred Channels: Social media ranks first in the U.S., while the U.K. favors email.
- ROI of UX Investment: Every $1 invested in UX can yield a return of $100, representing a 9,900% ROI.
- Impact on Business Growth: Companies that prioritize UX see 1.5x faster revenue growth than their competitors.
- Design-Centered Companies Outperform: Design-driven companies have outperformed the S&P by 228% over 10 years.
- User Testing Effectiveness: Testing with 5 users can uncover 85% of usability issues.
- AI in Customer Service: 80% of businesses plan to use chatbots by 2024.
- Voice Search: Expected to account for 50% of all online searches by 2024.
- Slow Loading Times: 88% of users leave due to slow speeds.
- Poor Mobile Optimization: 73% abandon non-responsive sites.
What Drives User Loyalty in Digital Experiences?
User loyalty is primarily driven by personalization, with 90% of users more likely to stay engaged with brands that offer tailored interactions. Personalized recommendations, targeted content, and a user-centered approach build trust and foster repeat engagement, making personalization a cornerstone of digital loyalty strategies.
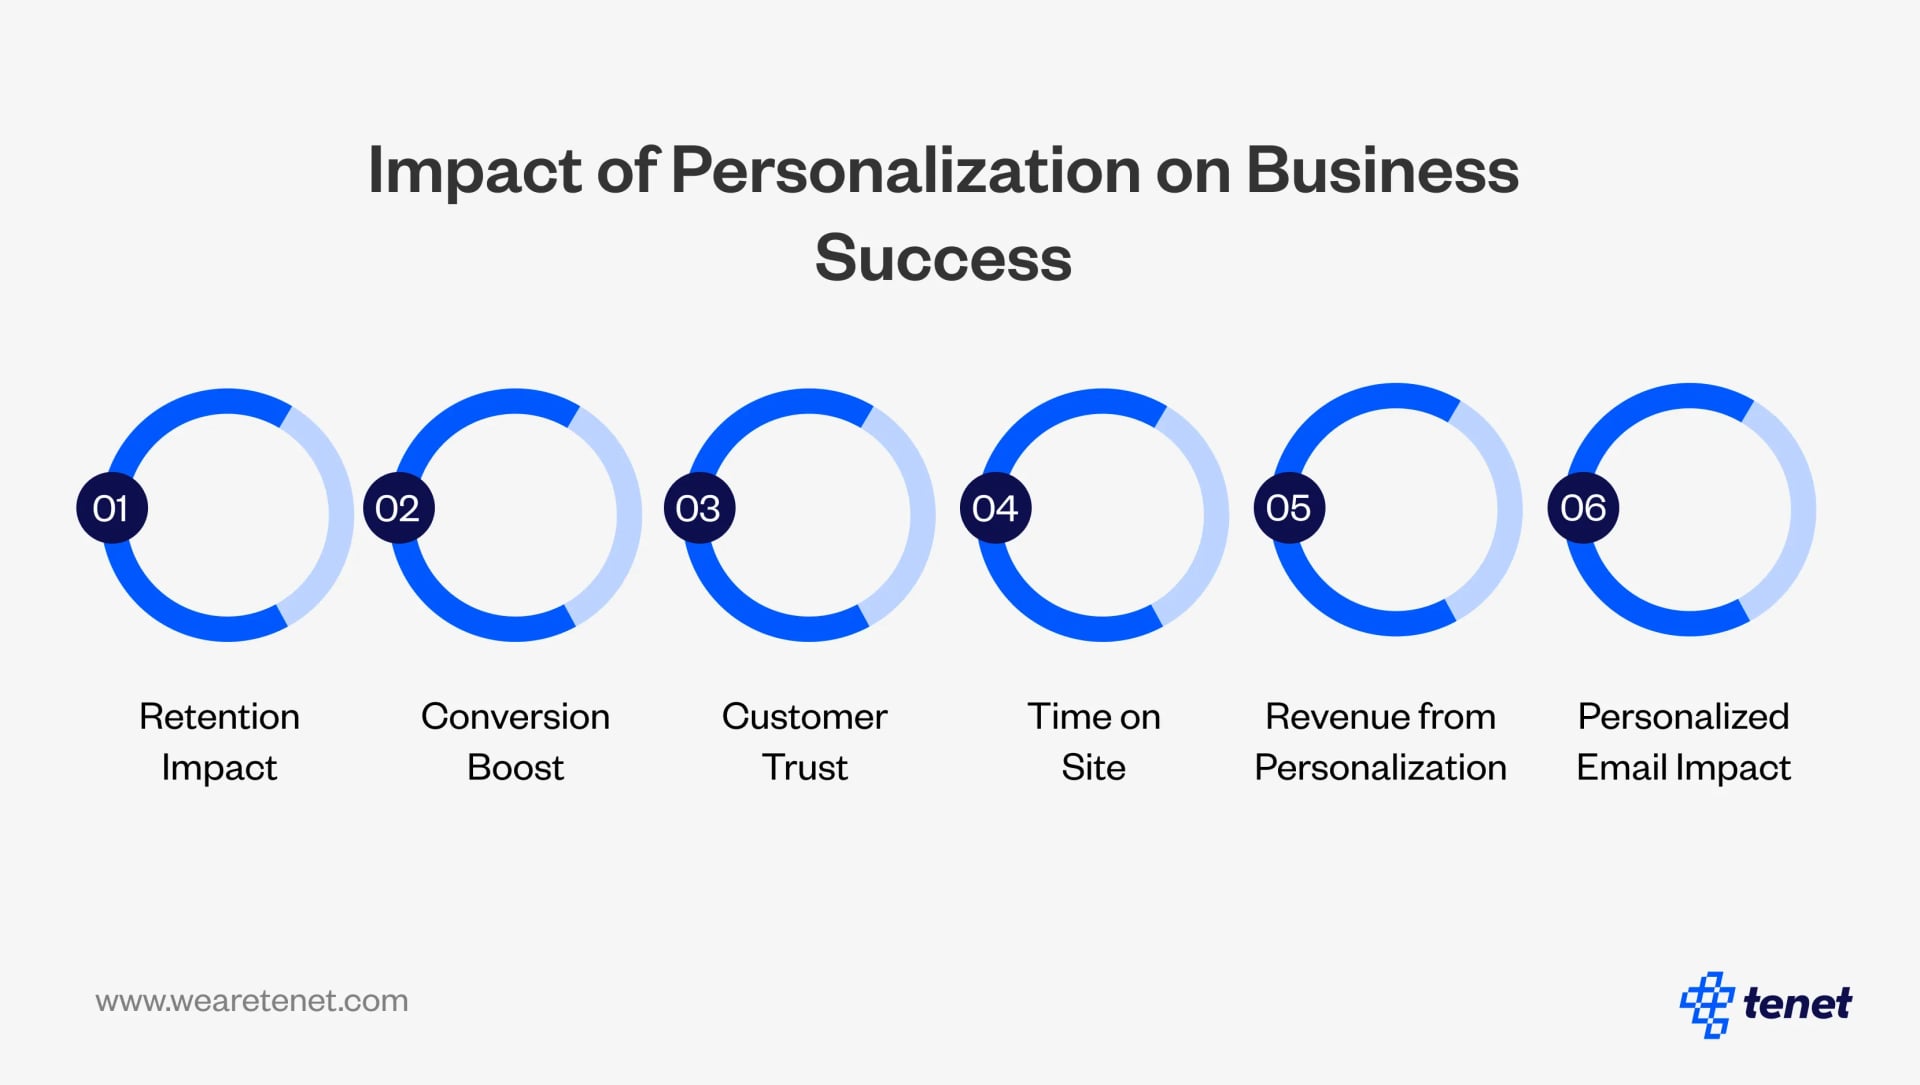
Personalization Statistics
- Retention Impact: Personalized content can increase customer retention by up to 20%.
- Conversion Boost: Tailored calls-to-action lead to a 42% higher conversion rate.
- Customer Trust: 61% of users feel more trusting toward brands that personalize their interactions.
- Time on Site: Personalized sites see users spending 34% more time engaging with content.
- Revenue from Personalization: Companies that prioritize personalization see 20% higher customer satisfaction rates and 15% increases in revenue.
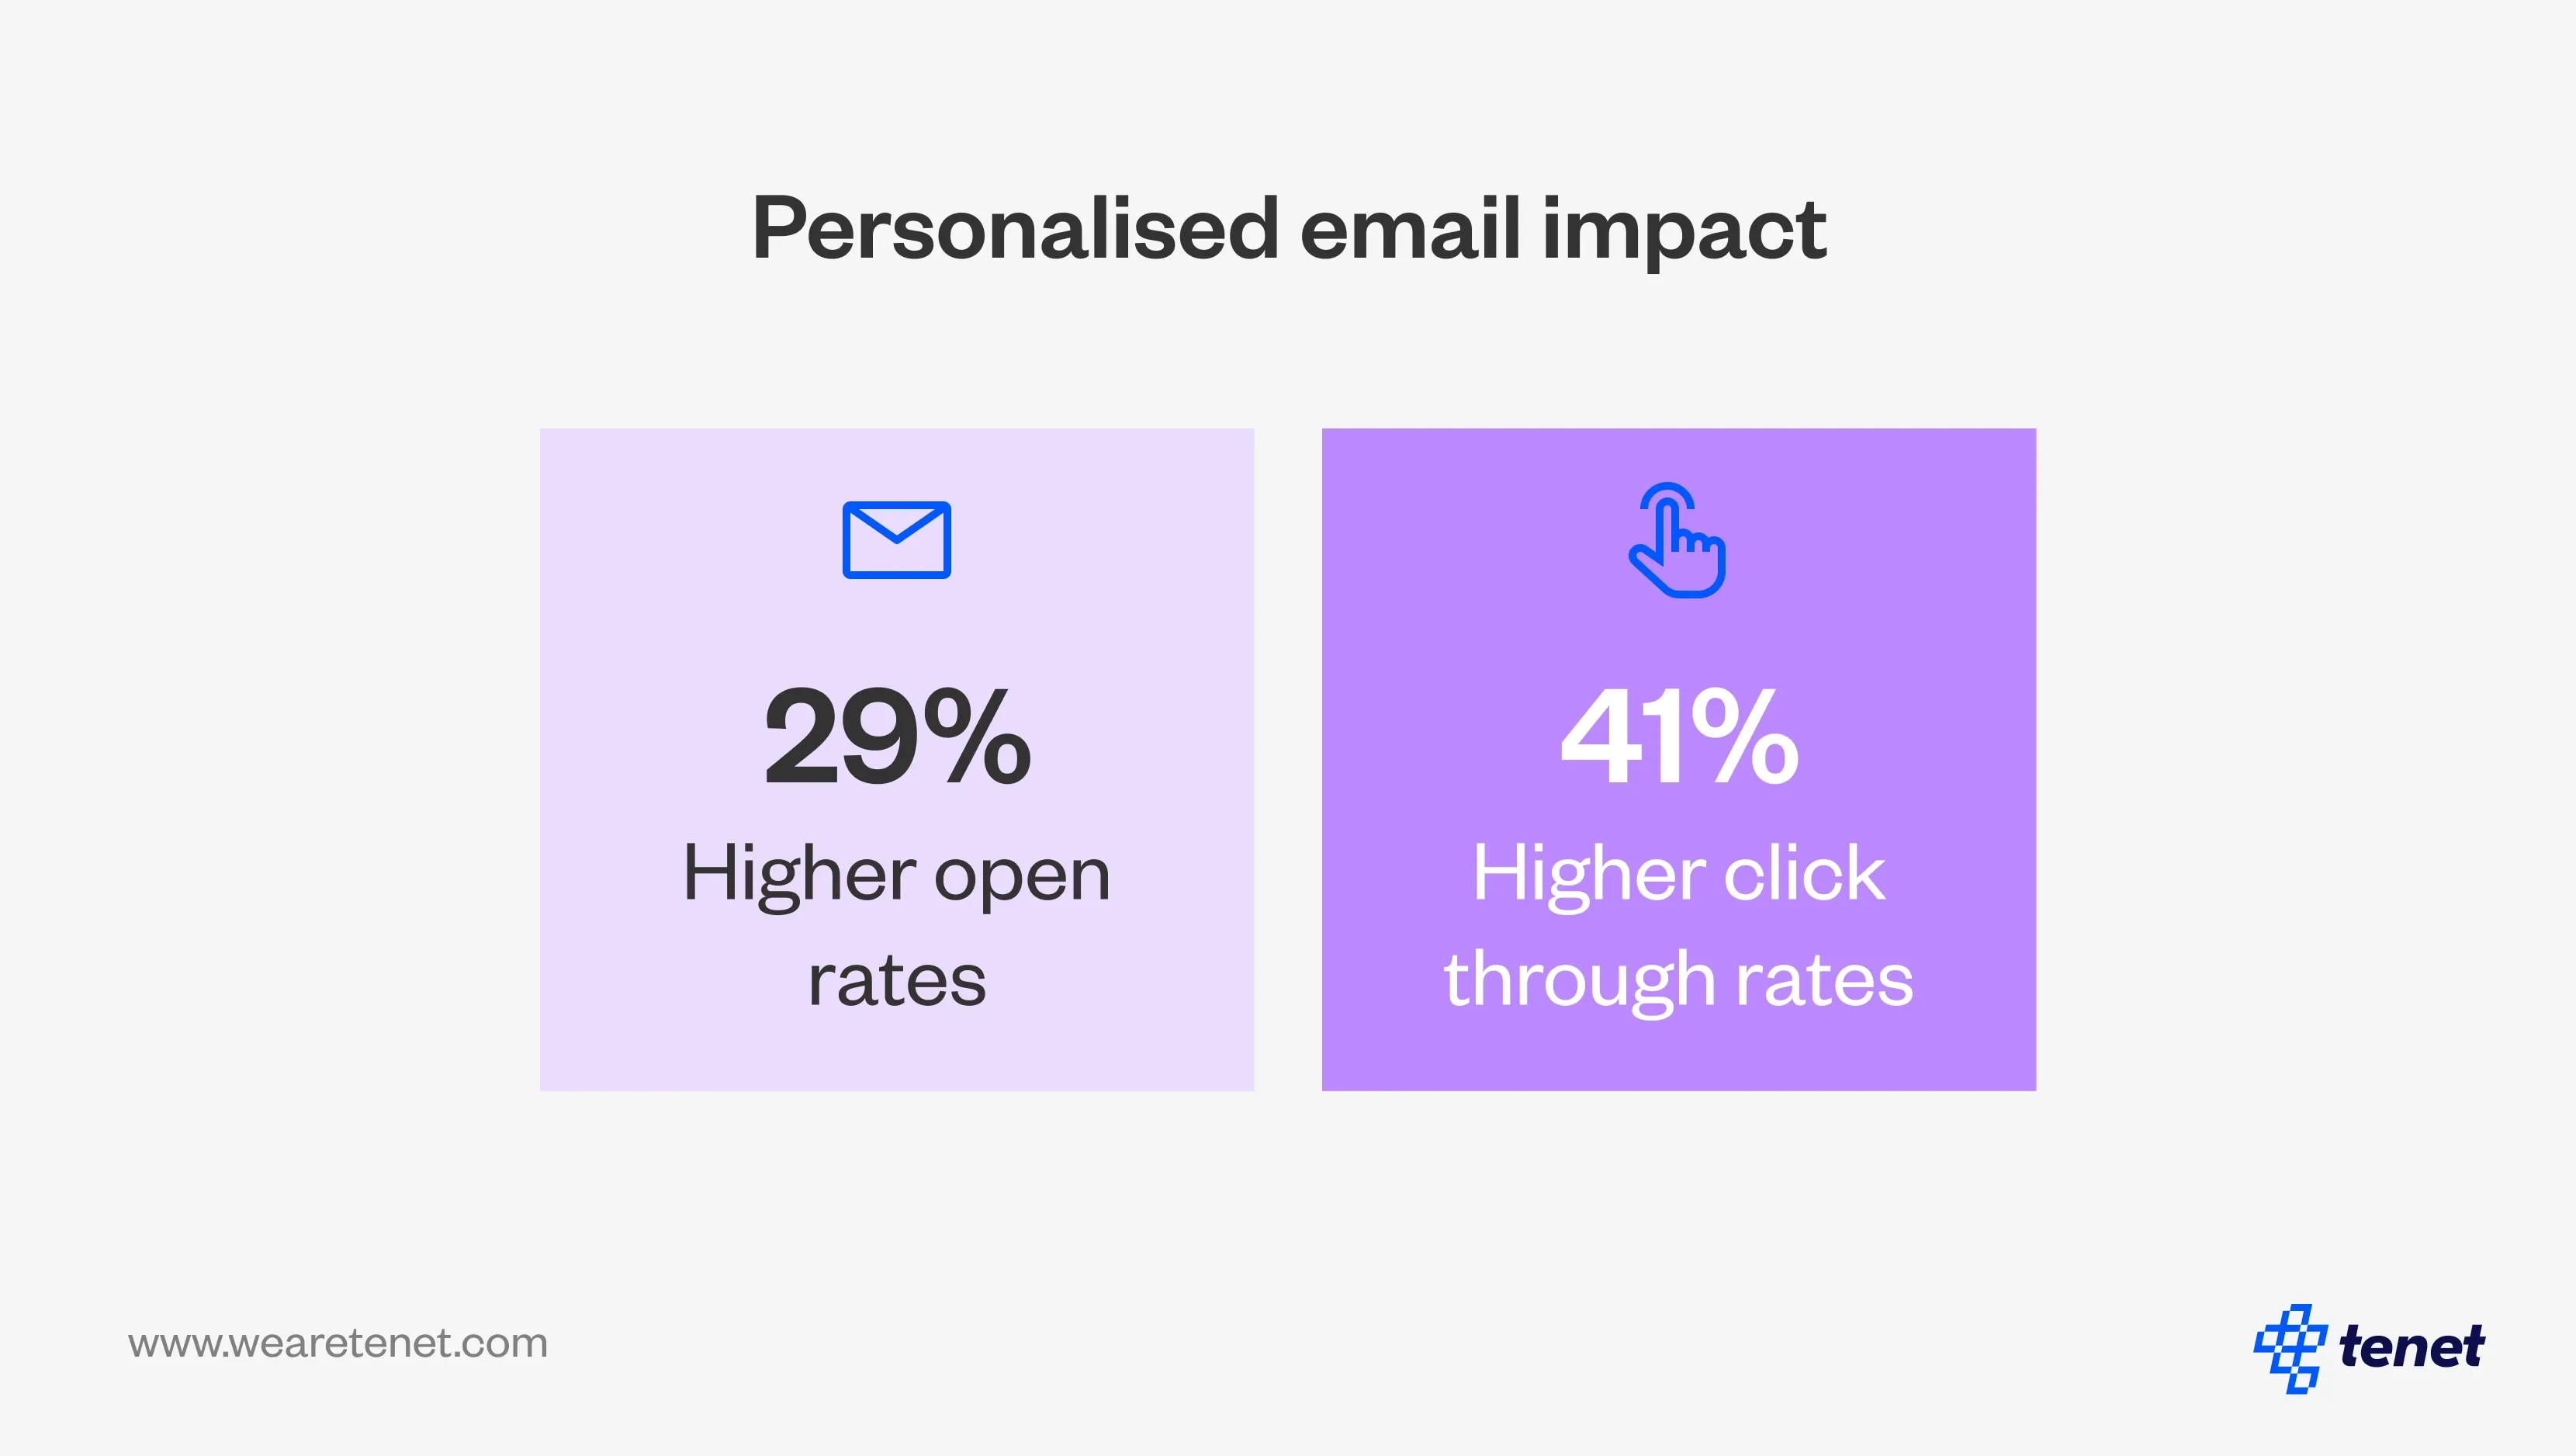
- Personalized Email Impact: Personalized email campaigns deliver 29% higher open rates and 41% higher click-through rates than non-personalized ones.
Why Is Mobile Optimization So Important?
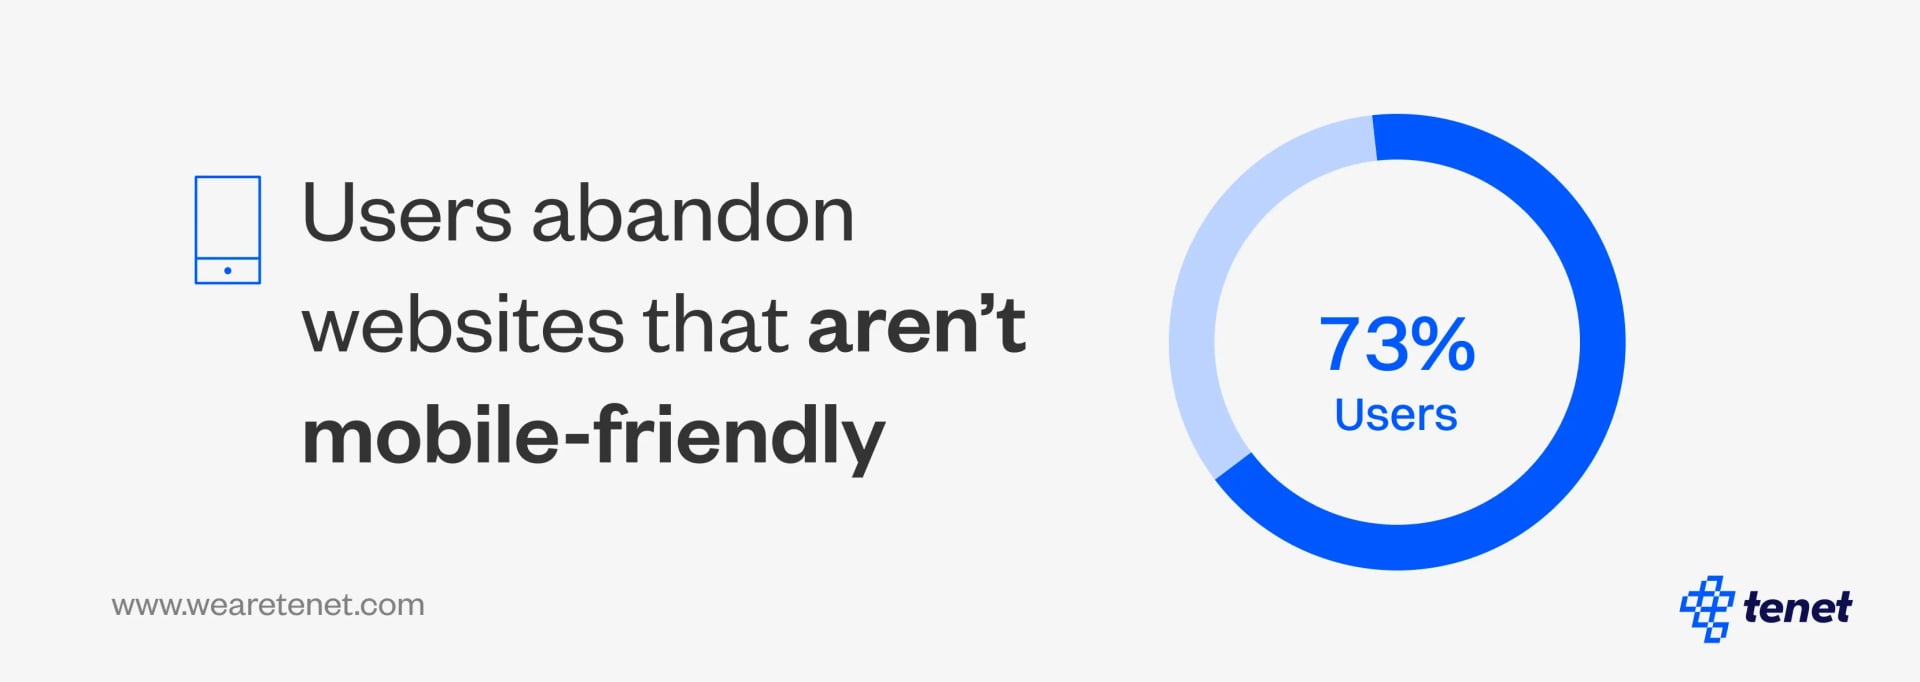
Mobile optimization is essential in today’s mobile-first environment, with 73% of users abandoning non-mobile-friendly websites. Ensuring a smooth mobile experience retains users and improves SEO, as search engines prioritize mobile-responsive sites.
Mobile Optimization Insights
- User Abandonment: 73% of users leave if a site isn’t mobile-friendly.
- Traffic Source: Mobile devices contribute to over 50% of global online traffic.
- SEO Advantage: Mobile-friendly sites rank higher in search results, increasing visibility and click-through rates.
- Shopping Cart Abandonment: 85.65% of mobile users abandon their shopping carts if the experience isn’t optimized for mobile.
- Mobile-Only Users: 50% of users in the U.S. access the internet exclusively through mobile devices.
- Mobile Conversion Rates: Websites that are mobile-friendly can increase conversions by 30%.
How Quickly Should Brands Respond to Users?
Response time is a significant factor in user satisfaction, with 52% of consumers expecting engagement within one hour on digital platforms. Delays in response can decrease satisfaction, especially on high-frequency channels like social media and in-app messaging.
Response Expectations by Platform
- Social Media: Users expect responses within 60 minutes, and delays can reduce satisfaction by 15%.
- Email: 80% of users anticipate a response within 24 hours.
- Live Chat: 79% of consumers prefer live chat for immediate assistance.
- Mobile Response Time Expectations: 53% of users leave a mobile page if it takes more than three seconds to load.
- Customer Retention Impact: 82% of consumers say an immediate response is crucial when they have marketing or sales questions.
- Preferred Response Time for E-commerce: In e-commerce, 90% of customers expect an immediate response when contacting support.
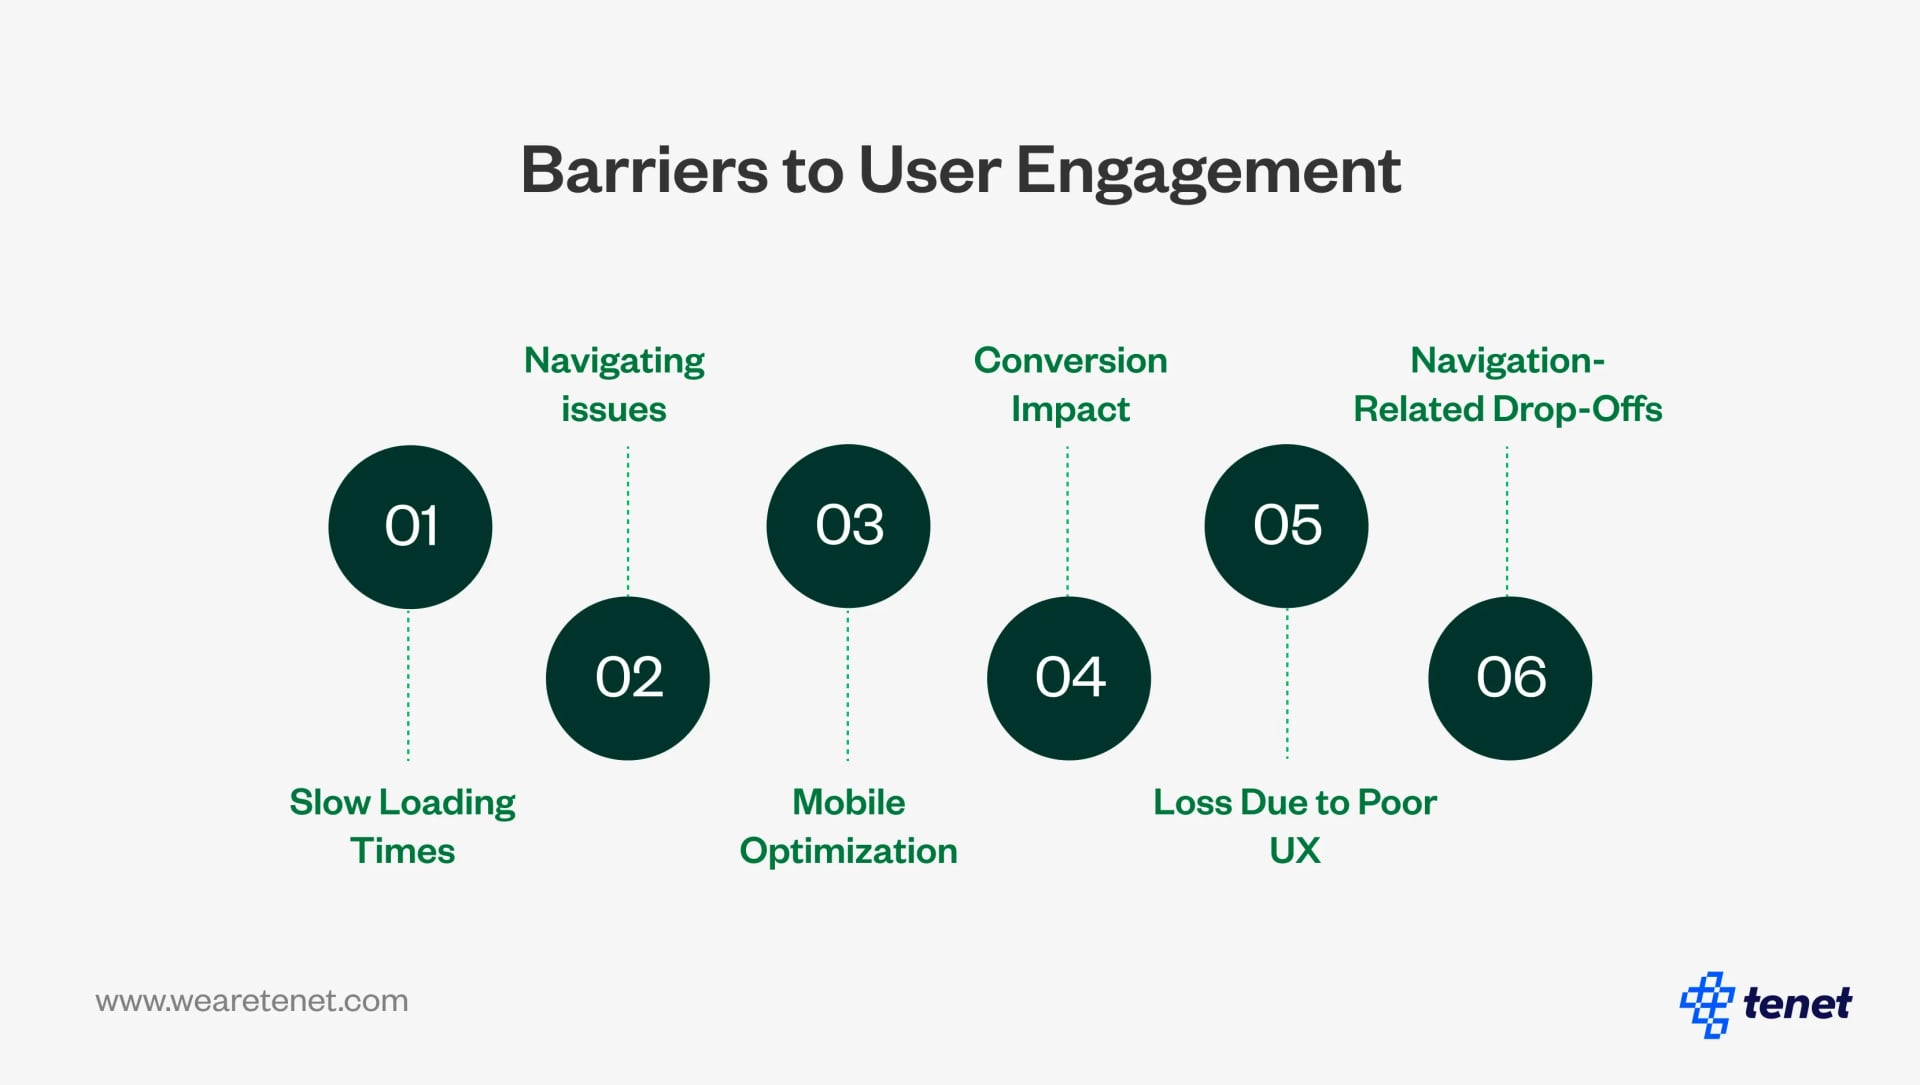
What Are the Top UX Challenges That Lead to User Attrition?
UX challenges such as slow loading times, poor mobile responsiveness, and complex navigation contribute significantly to user drop-offs. Addressing these issues is crucial for retaining users and boosting engagement.
Common UX Attrition Factors
- Slow Loading Times: 88% of users leave if a site loads too slowly.
- Navigation Issues: 61% of users exit websites due to unclear or difficult navigation.
- Mobile Optimization: A lack of mobile responsiveness causes 73% of users to abandon the site.
- Conversion Impact: A one-second delay in page response can lead to a 7% reduction in conversions.
- Loss Due to Poor UX: Poor user experience costs U.S. companies $1.4 trillion annually in lost business.
- Navigation-Related Drop-Offs: 67% of users will abandon a site if it takes too many steps to complete a simple action.
How Does AI Enhance User Engagement?
AI is transforming user interactions through personalized experiences, predictive recommendations, and efficient support solutions like chatbots. By streamlining customer interactions and making content more accessible, AI fosters higher engagement and satisfaction.
AI-Driven User Engagement
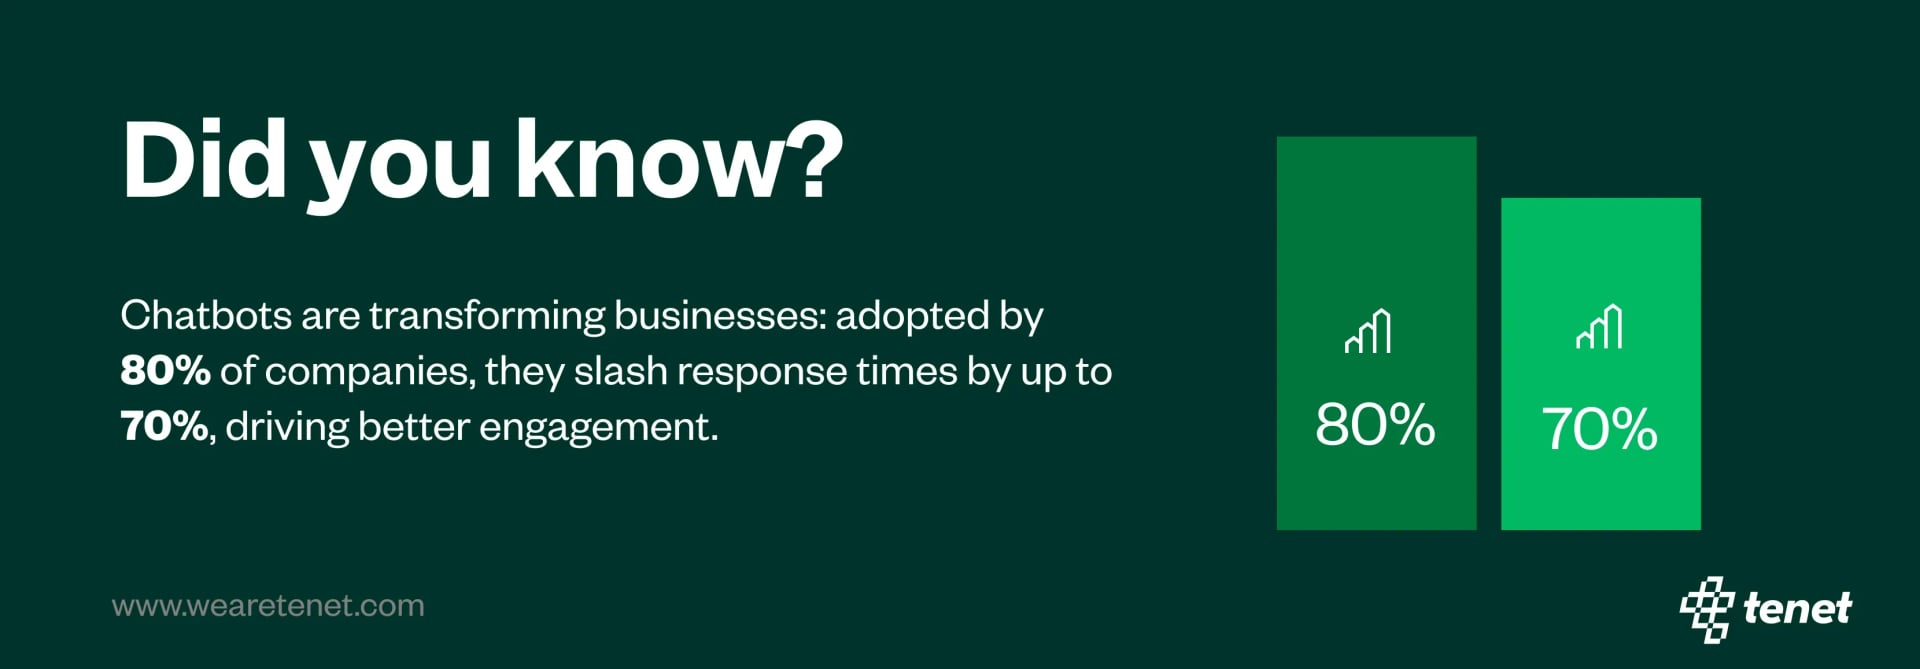
- Chatbots: 80% of companies now use chatbots, improving response times by up to 70% and increasing engagement.
- Personalized Recommendations: AI-driven suggestions boost sales by 30% and improve satisfaction rates.
- Sales Impact: AI-driven recommendations can increase sales by 30%, significantly enhancing personalized engagement.
- Voice Search: Expected to make up 50% of all searches by 2024, voice-activated search enhances accessibility and user convenience.
- Chatbots for E-commerce: E-commerce sites using chatbots report up to 10x higher engagement rates.
- AI-Driven Loyalty Programs: Companies using AI in loyalty programs report a 17% increase in customer retention rates.
- Voice Shopping Growth: Voice shopping is predicted to hit $40 billion in the U.S. by 2024.
Which Channels Do Users Prefer for Brand Engagement?
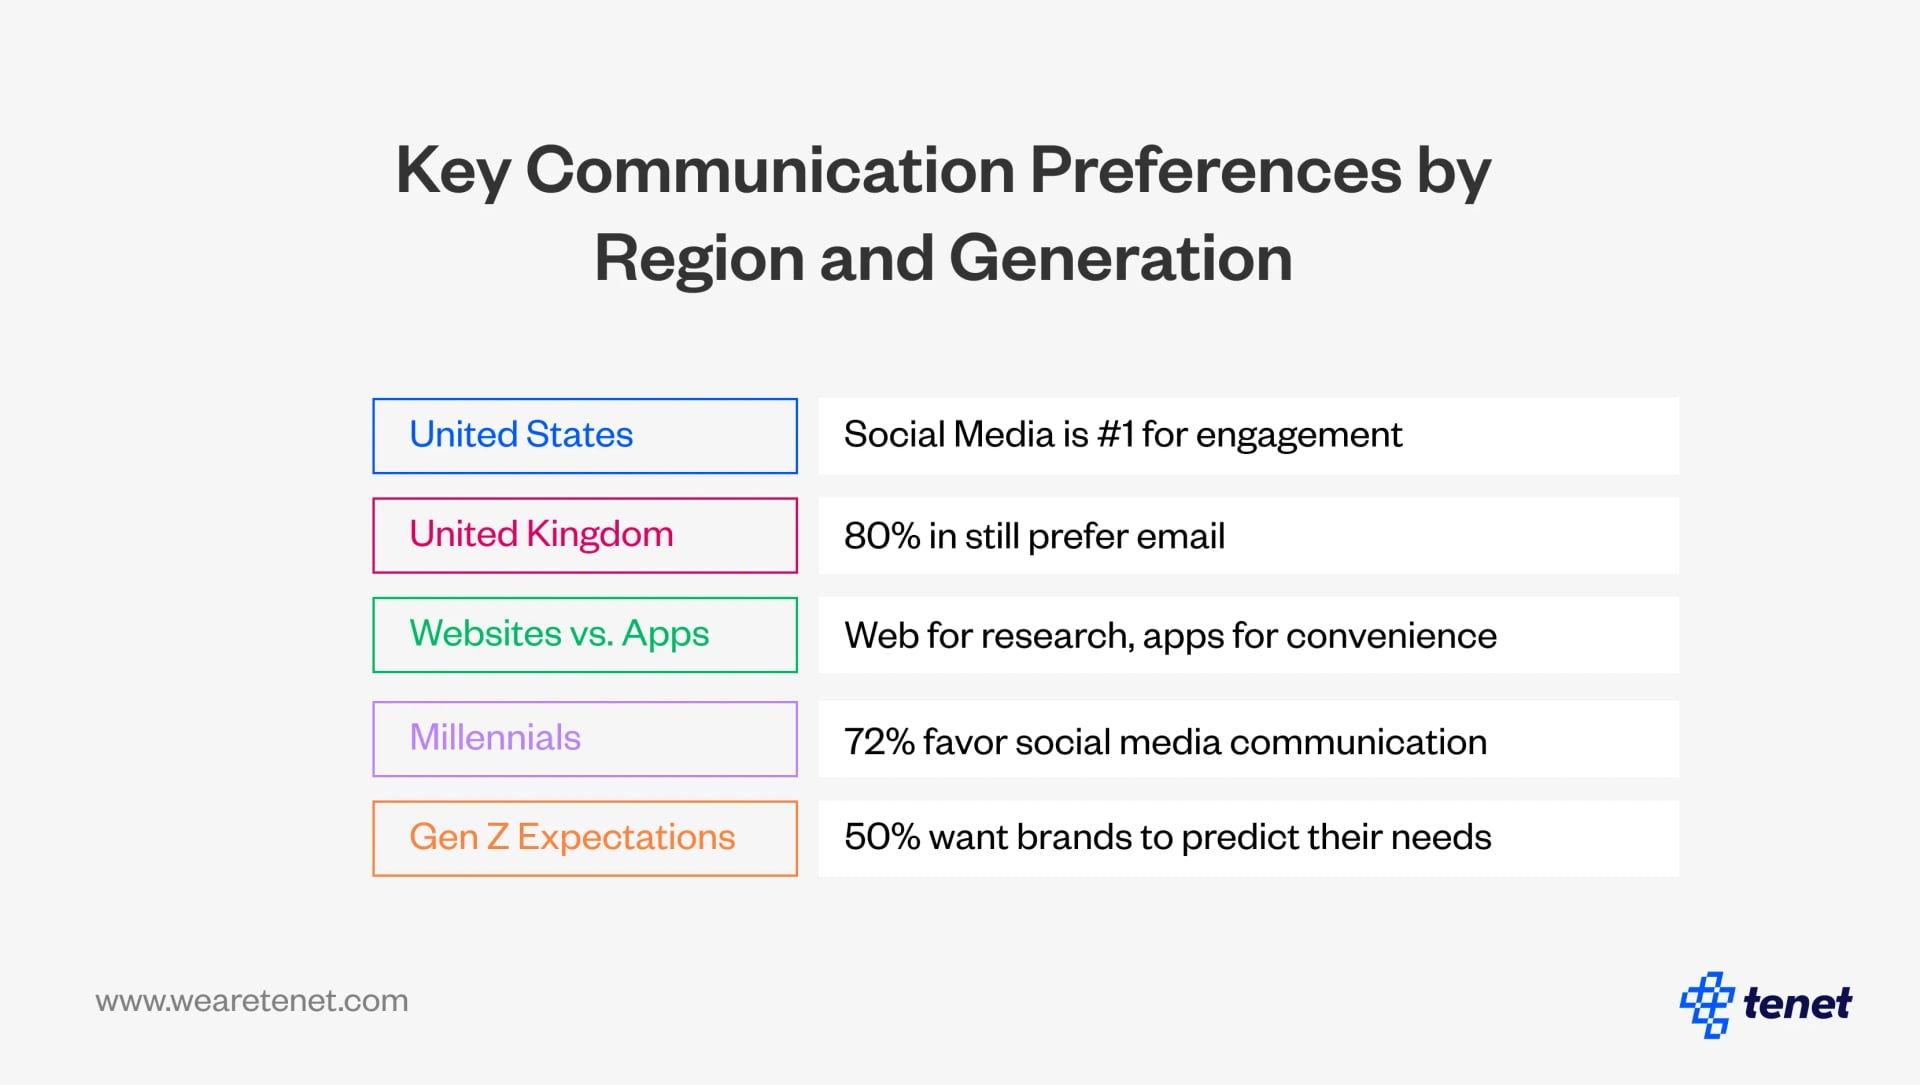
Preferred engagement channels vary by region and platform type, with social media leading in the U.S. and email popular in the U.K. Brands should adapt their communication strategies based on these preferences to connect effectively with their target audiences.
Channel Preferences by Region
- United States: Social media is the preferred platform for brand interaction, reflecting a preference for direct and immediate communication.
- United Kingdom: Email remains the primary channel, though social media is a close second for customer service.
- Websites vs. Apps: Websites are commonly used for research, while apps are favored for personalized, on-the-go experiences.
- U.S. vs. U.K. Preferences: Social media leads as a preferred channel in the U.S., while 80% of users in the U.K. prefer email for brand interaction.
- Channel Preferences for Millennials: 72% of millennials prefer brands that communicate via social media.
- Generational Differences: 50% of Gen Z users expect brands to intuitively understand their preferences without being told.
Why Are Personalized Experiences More Engaging?
Users are more likely to engage with brands that offer relevant, tailored experiences. Personalization makes interactions meaningful, leading to higher engagement, repeat visits, and increased conversions.
Benefits of Personalization
- Increased Time on Site: Personalized content encourages users to spend 34% more time on a site.
- Trust and Loyalty: 48% of users are more likely to remain loyal to brands that personalize experiences.
- Higher Satisfaction: Personalization improves satisfaction and strengthens brand loyalty.
AI in User Experience: Driving Real-Time Engagement
How is AI Driving Real-Time Engagement in User Experience?
AI drives real-time engagement by making digital interactions faster, smarter, and more personalized. It uses predictive recommendations, instant support, and dynamic content to match user needs in the moment. This creates smoother journeys, keeps users active longer, and increases retention.
How Do Chatbots Improve Customer Service?
Chatbots improve customer service by giving instant answers and reducing wait times. Around 80% of businesses now use or plan to use chatbots for routine queries. They handle common questions, free up human agents, and make users feel supported anytime. This increases satisfaction and lowers drop-offs.
Why Is Voice User Interface (VUI) Important for Accessibility?
VUI is important because it allows hands-free access to apps and websites. With voice search expected to make up 50% of all searches, users rely on VUI for speed and convenience. It also supports people with disabilities by making digital experiences easier and more inclusive.
How Do Personalized Recommendations and AI-Driven Content Increase Engagement?
Personalized recommendations increase engagement by showing users exactly what they want. AI algorithms suggest products, content, or services based on behavior and preferences. This boosts sales by up to 30% and makes users spend more time interacting with a brand. Dynamic, AI-driven content keeps experiences relevant and meaningful.
UX Design Tools and Emerging Trends
How does expressive typography impact UX?
Expressive typography brings personality to UX by helping brands convey unique identities, used by 61.5% of designers to create memorable experiences. This design element strengthens brand presence and user engagement.
Why is VUI (Voice User Interface) a key trend?
VUI is essential in 2024 as 50% of online searches are expected to be voice-activated, making it a vital tool for accessibility and user convenience. Voice interfaces allow hands-free navigation, expanding usability for all users.
Top Reasons for User Abandonment and Attrition
User abandonment can reduce conversions by up to 70%, with research showing that optimizing design, performance, and mobile responsiveness can increase retention rates by 30-40%. Prioritizing user-centered improvements significantly enhances satisfaction and loyalty.
What effect does complex navigation have on user engagement?
Complex or poorly designed navigation can lead to frustration, causing 61% of users to leave a site. Simplified, intuitive navigation helps users find information quickly, improving their experience and reducing drop-off rates.
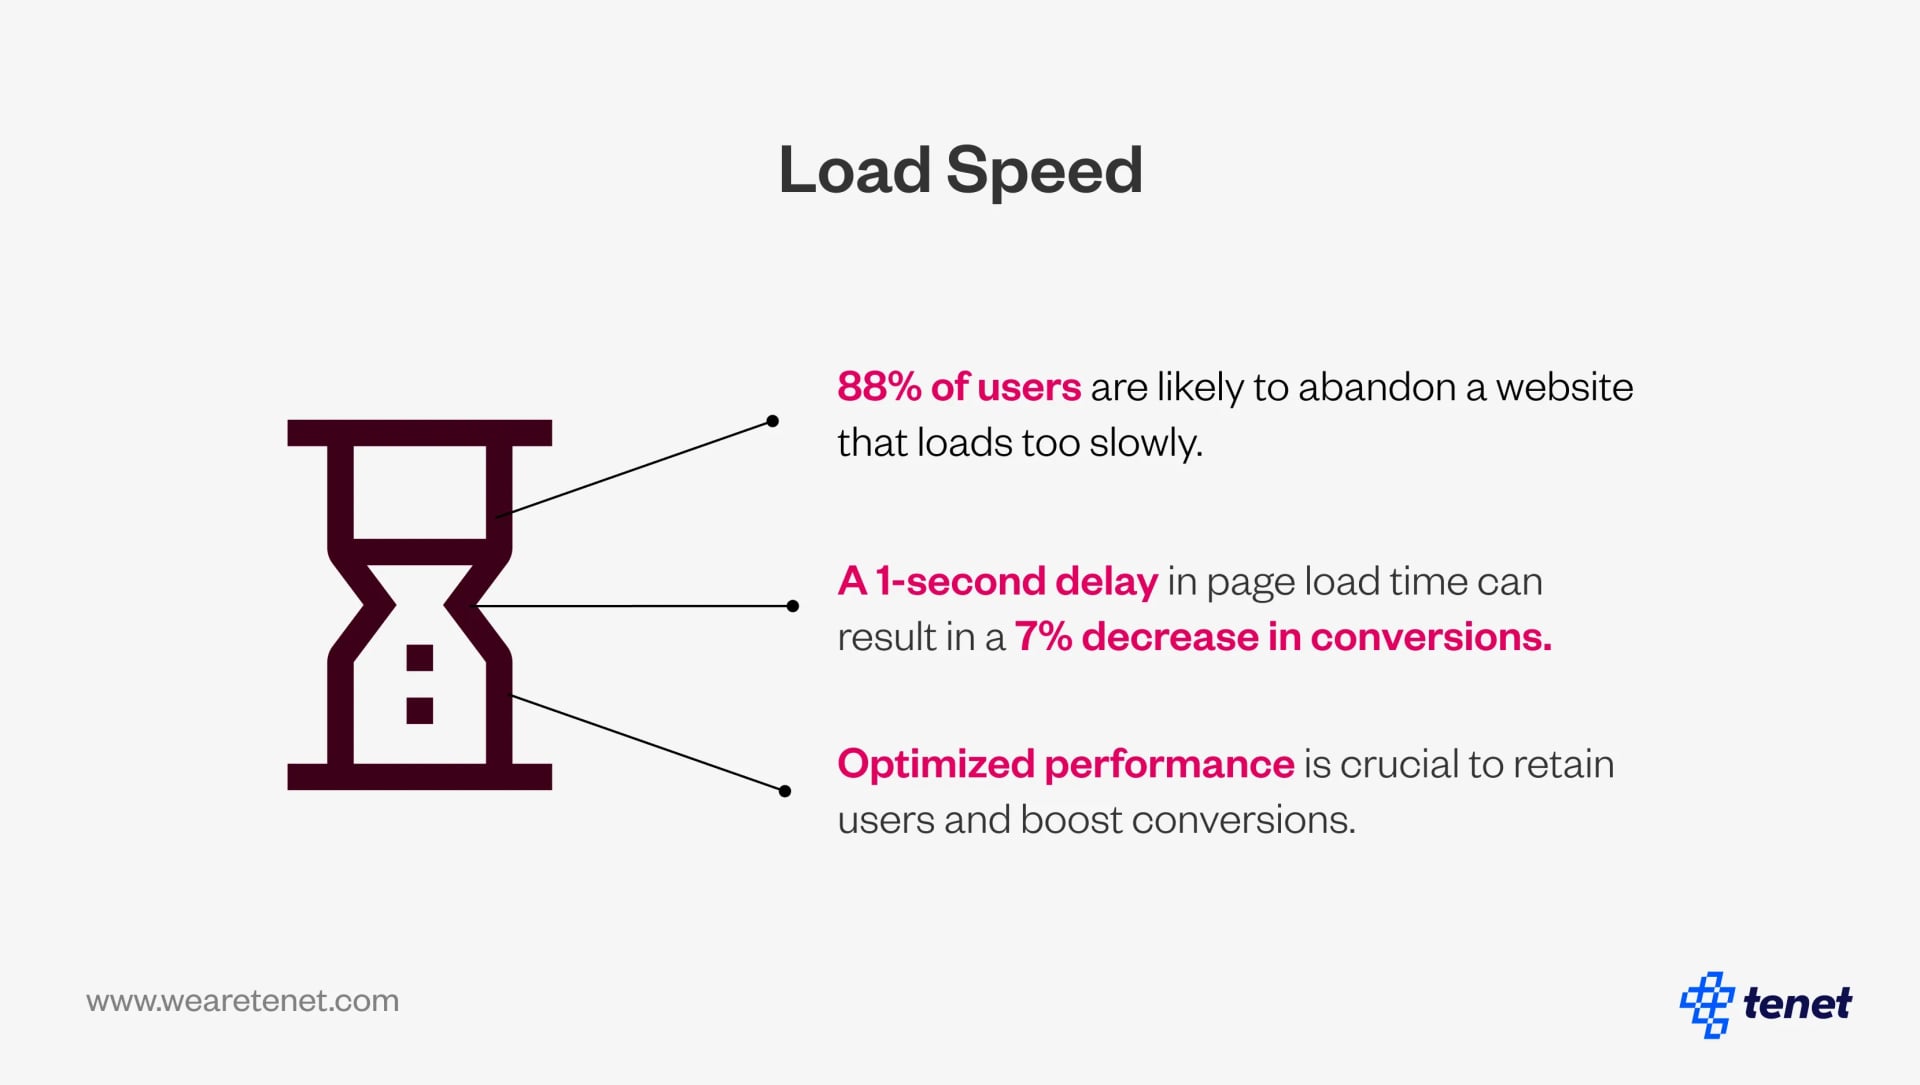
How does page load speed impact user decisions?
A slow page load speed can drastically affect user behavior, with 88% of users likely to abandon a website that loads too slowly. Even a 1-second delay can cause a 7% decrease in conversions, emphasizing the need for optimized performance.
Strategies to Improve Page Load Speed
- Optimize Images: Use compressed images to reduce load times without sacrificing quality.
- Implement Lazy Loading: Load content as users scroll rather than loading the entire page at once, especially for media-rich sites.
- Use a Content Delivery Network (CDN): CDNs improve load times by distributing content across multiple servers closer to users.
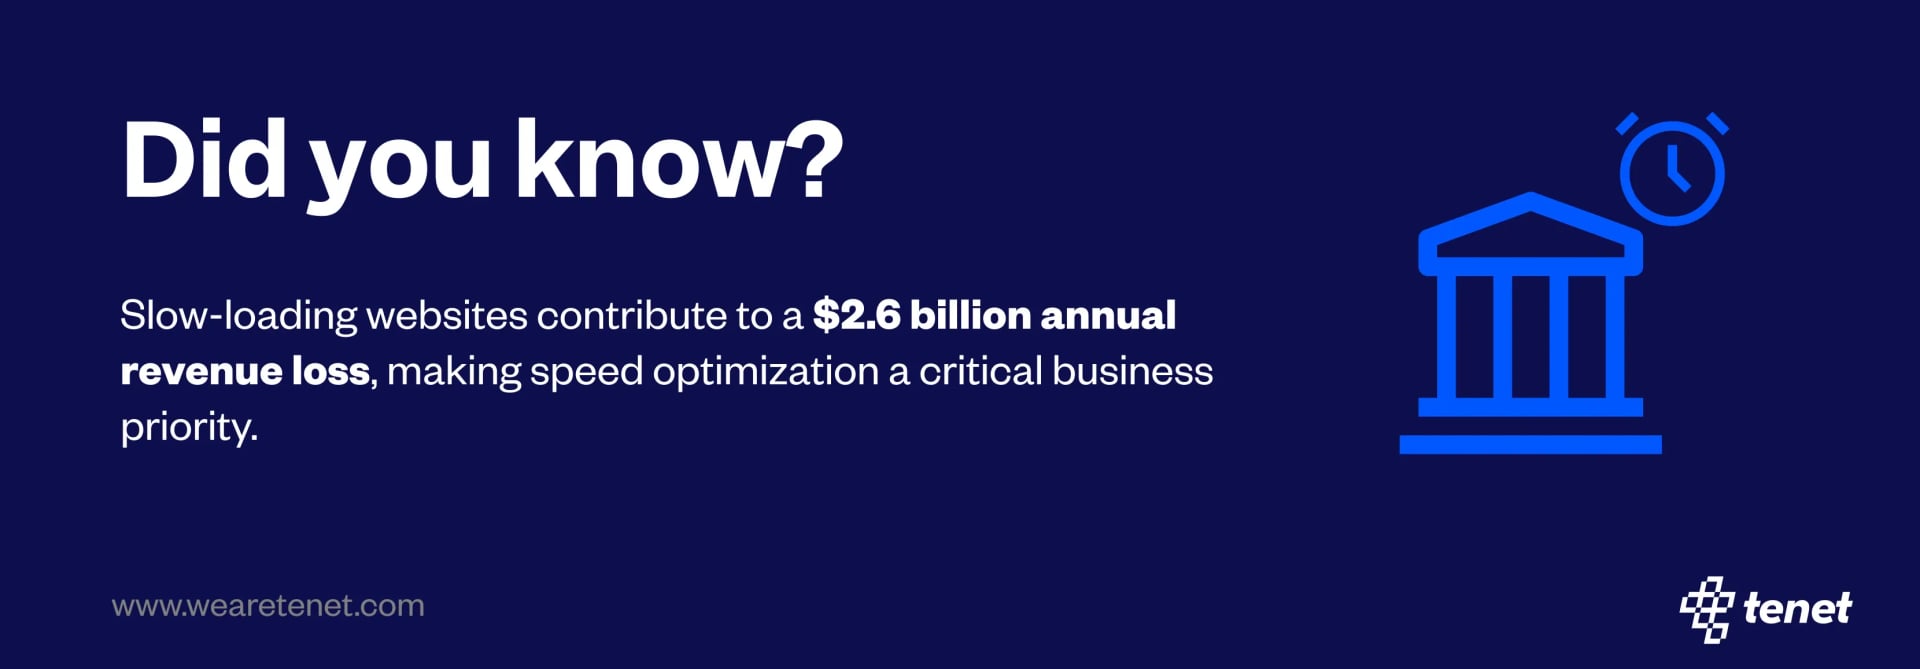
- Revenue Impact: $2.6 billion in revenue is lost annually due to slow-loading websites.
- Revenue Impact of Slow Pages: Every additional second of load time beyond three seconds can decrease conversion rates by up to 20%.
- Improving Page Speed: Walmart found that for every 1-second improvement in page load time, conversions increased by 2%.
Data sources
To conduct this listicle article, we have curated data and insights from the following sources:
- s3.amazonaws.com
- www.slideshare.net
- www.popwebdesign.net
- landing.adobe.com
- visual.ly
- www.thinkwithgoogle.com
- worldusabilitycongress.com
- poi
- hbswk.hbs.edu
- maze.co
- www.redpointglobal.com
- www.twilio.com
- go.emplifi.io
- www.janbaskdigitaldesign.com
- blog.sagipl.com
- www.goodfirms.co
- www.thinkwithgoogle.com
- www.forbes.com
- baymard.com
- ledgeviewpartners.com
👉 Tools that will help you in UX research and design:
Why companies choose Tenet for UX design services
Companies choose Tenet for their proven track record of delivering exceptional UX design services that drive business growth.
With a 98% client satisfaction rate, expertise across 15+ industries, and experience working with Fortune 1000 companies, Tenet transforms digital experiences through innovative, data-driven design solutions that deliver measurable results.
👉 Contact our experts to learn more about our UI/UX design services.
👉 Explore related UI/UX glossary terms:
User experience (UX) design FAQs
What is the return on investment (ROI) for UX design?
Every $1 invested in UX design yields an average return of $100, representing a 9,900% ROI. Businesses that prioritize UX experience 1.5x faster revenue growth compared to those that don't. Over a 10-year period, design-driven companies have outperformed the S&P index by 228%, proving that UX directly supports long-term financial performance.
Why is mobile optimization critical for user retention and conversions?
73% of users abandon websites that are not mobile-friendly. Mobile devices now account for over 50% of global web traffic, and 85.65% of mobile users leave their shopping carts if the mobile experience is poor.
Sites that are optimized for mobile can increase conversion rates by up to 30%, and they also rank higher in search engine results.
👉 Explore 20+ SaaS app UI, UX, and design examples for inspiration
How does personalization improve user engagement and loyalty?
Personalization drives 90% higher user loyalty by creating tailored interactions such as customized recommendations and content.
Personalized calls-to-action lead to a 42% increase in conversions, while personalized emails deliver 29% higher open rates and 41% higher click-through rates. Sites with personalized experiences also see users spend 34% more time engaging with content.
What response time do users expect from brands?
52% of users expect a response within one hour of contacting a brand, especially on platforms like social media or live chat. In e-commerce, 90% of customers expect an immediate response, and 82% say quick replies are critical to retention. Delayed engagement can lower satisfaction by 15%, impacting brand trust and sales.
What UX issues most commonly cause users to abandon a website?
Slow loading speeds cause 88% of users to leave a site. Poor mobile responsiveness leads 73% to abandon a page, and 61% of users exit if navigation is unclear. A one-second delay in page response time can reduce conversions by 7%, and $2.6 billion in annual revenue is lost due to slow-loading websites.
How does AI enhance the user experience on websites and apps?
AI-driven features like chatbots, personalized recommendations, and voice interfaces improve response speed and engagement. Chatbots reduce response times by up to 70% and increase user engagement by as much as 10x in e-commerce.
Personalized AI recommendations boost sales by 30%, and AI-powered loyalty programs raise retention rates by 17%.
How does complex navigation impact user behavior?
61% of users abandon websites with complicated or unclear navigation. If completing a task requires too many steps, 67% will leave the site entirely. Simplified, intuitive navigation improves user satisfaction and increases the likelihood of conversion.
What is the impact of voice search on modern UX?
Voice search is expected to account for 50% of all online searches in 2024 and beyond. Voice User Interfaces (VUI) offer hands-free, accessible browsing, especially for users with disabilities or those using mobile devices.
VUI enhances inclusivity and supports faster content discovery, improving overall user satisfaction.
Why do users abandon mobile shopping carts at such high rates?
85.65% of mobile users abandon shopping carts due to slow performance, poor mobile design, or a difficult checkout process. Ensuring mobile responsiveness and streamlining the checkout experience can dramatically improve conversion rates and customer retention on mobile devices.
How many users are needed for effective UX testing?
Testing with just 5 users can uncover 85% of usability issues. This small-sample method is both cost-effective and efficient for identifying problems early in the design process, making it a best practice in UX research.
What makes flat design popular among UX professionals?
Flat design is used by 88.5% of UX designers due to its clean, simple style that enhances usability and responsiveness. It reduces visual clutter, loads faster, and adapts easily across device types, improving overall user experience and design scalability.
How do personalized loyalty programs affect user retention?
Companies that use AI-driven personalization in loyalty programs report a 17% increase in customer retention. Personalized rewards and predictive engagement strategies build stronger customer relationships and encourage long-term brand loyalty.
How does page load speed affect user decisions and revenue?
A one-second delay in page load time can cause a 7% drop in conversions. Every second beyond three seconds can reduce conversion rates by up to 20%. Walmart found that improving page load by just one second increased conversions by 2%. Fast-loading sites retain more users and generate higher revenue.
Which platforms do users prefer for brand engagement?
In the U.S., users prefer interacting with brands on social media, while in the U.K., email is still the most used platform. 72% of millennials favor brands that use social media, and 80% of U.K. users prefer email. Generational differences influence channel strategy, making it essential to tailor communication by region and age group.
Get a free consultation with our UX experts
Get a free consultation with our UX experts


Got an idea on your mind?
We’d love to hear about your brand, your visions, current challenges, even if you’re not sure what your next step is.
Let’s talk


